
Dear Users, Welcome to PTMoreR
PTMoreR is a web-based tool, which possesses the core functions, including:
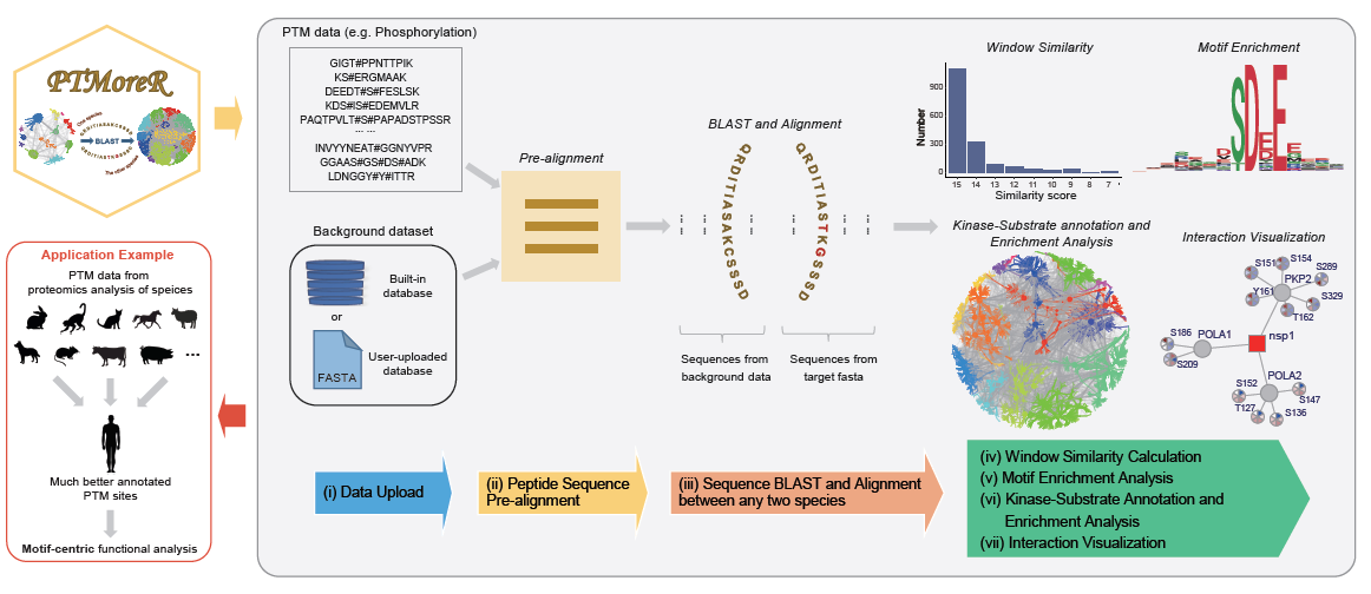
1. Mapping the PTM sites and protein sequences between any species and Human;
2. Calculating sequence window similarity and allowing filtering thresholds of sequence similarity during the mapping;
3. Performing PTM site-specific enrichment analysis and offering flexible annotations based on kinase-substrate database and network plots;
4. Visualizing the regulation of modification sites on the basis of protein-protein interaction data.
In addition, this tool supports both online access and local installation. The source codes and installation instructions can be available in the GitHub repository: https://github.com/wangshisheng/PTMoreR under an MIT license.
Finally, PTMoreR is developed by R shiny (Version 1.6.0), and is free and open to all users with no login requirement. It can be readily accessed by all popular web browsers including Google Chrome, Mozilla Firefox, Safari and Internet Explorer 10 (or later), and so on. We would highly appreciate that if you could send your feedback about any bug or feature request to Shisheng Wang at shishengwang@wchscu.cn.
Friendly suggestions:
a) Open PTMoreR with Chrome, Mozilla Firefox, Safari or Firefox;
b) The minimum operating system specifications are: RAM 4GB, Hard drive 500 GB;
c) The monitor resolution (>= 1920x1080) is better.
^_^ Enjoy yourself in PTMoreR ^_^
© 2024 Yansheng Liu's Group and Hao Yang's Group. All Rights Reserved.
Created by Shisheng Wang. E-mail: shishengwang@wchscu.cn.
User Guide
There are 6 steps to process data in PTMoreR, please do it step by step:
Step 1. Import Sequence Data. In this part, users can upload their own peptide sequences with modification (e.g. phosphorylation). The example data were obtained from Rat and can be found when users click 'Load example data' below.
Step 2. Pre-alignment. This step aligns those peptide sequences with the background database (protein sequences) and force the modified sites/residues to be central sites, then users can get the standard peptide window sequences (e.g. 15 amino acid length by default).
Step 3. Blast to Human (or other species). This step will map the PTM site and protein sequences and identifiers between two species (One is that you chose in Step 1 and the other is that you want to blast to, which is Human by default. Please note: if users choose other species, this tool would take more time to blast.
Step 4. Motif Enrichment and Plot. This step will find overrepresented sequence motifs for uploaded peptides and blasted peptides respectively, then visualize them. Uploaded peptides here means those modified peptides uploaded directly by users.
Blasted peptides here means those modified peptides mapped to human after blasting.
Step 5. Annotation and enrichment analysis based on Kinase-Substrate database. This step will offer more flexible annotation based on kinase-substrate databases (e.g. PhosphoSitePlus) and network plots.
Step 6. Interaction Plot. This step will visualize the expression of modification sites on interacting proteins on the basis of protein-protein interaction data.
Enter your email here (Optional, please also check junk mail if possible):
Step 1. Import Sequence Data.
Input Parameters
Results
Sequence data:
Step 4. Motif Enrichment and Plot.
Input Parameters
Results
Hints: Herein, uers should type in a protein name/uniprot id with a phosphosite (e.g. AKTS1_T246 or Q96B36_T246) below. Then PTMoreR will search the sequences across mammalian species aligned and calculate PWM (named PWM_input). After that, this tool will calculate PWMs for each human kinase in PhosphoSitePlus database (named PWM_PsP). Finally, this tool will evaluate the cosine similarity between PWM_input and PWM_PsP.
Step 5. Annotation and enrichment analysis based on Kinase-Substrate database.
Input Parameters
Step 6. Interaction Plot.